Abstract
Model disagreement and self-reported confidence are candidate indicators of error in language-model ensembles. We compared vote entropy with mean verbal uncertainty in an exploratory evaluation of 1,000 expert-labeled PubMedQA questions. Seven conditions from six model families produced 6,993 valid responses. A unique plurality defined the ensemble answer; seven refusals and four tied pluralities left 989 questions for the primary analysis. Error-detection area under the receiver operating characteristic curve (AUROC) was compared using a paired question bootstrap.
Ensemble accuracy was 80.1% (95% confidence interval [CI], 77.7-82.6). Mean verbal uncertainty achieved AUROC 0.763, compared with 0.708 for vote entropy; the entropy-minus-verbal difference was -0.055 (95% CI, -0.084 to -0.027). Unanimity increased accuracy to 89.4% at 69.5% coverage, but included 74 errors, of which 50 had MAYBE reference labels. Adding Astra low to the six-family panel yielded 35 additional answers, comprising 21 correct and 14 incorrect responses. In the paired Astra comparison, high effort increased accuracy by 0.4 percentage points (95% CI, -0.6 to 1.4) and reported confidence by 1.245 percentage points (1.114-1.377).
Mean verbal uncertainty discriminated ensemble errors more effectively than vote entropy on this benchmark. Agreement supported selective prediction, while errors among unanimous answers and poor MAYBE recall identified persistent difficulties with inconclusive evidence.
1. Introduction
Uncertainty estimation can support error detection and selective prediction in language-model ensembles. Cross-model disagreement provides one observable signal, while models' self-reported confidence provides another. Their relative value depends on how well they distinguish incorrect from correct ensemble answers and on the accuracy achieved at different levels of retained coverage.
PubMedQA pairs biomedical research questions with abstract context and expert YES, NO, or MAYBE labels.[1] It evaluates interpretation of supplied research evidence. Broader medical benchmarks, including M-QALM, distinguish this ability from medical knowledge recall.[2]
1.1. Related work
Tian and colleagues found that verbal confidence could be better calibrated than conditional token probabilities for the evaluated models and benchmarks.[3] Xiong and colleagues examined confidence elicitation through prompting, sampling, and aggregation, assessing both calibration and failure prediction.[4] These findings support self-reported confidence as a comparator for disagreement-based uncertainty.
Semantic entropy groups generated responses by meaning to detect unreliable generations.[5] Recent cross-model work combines within-model consistency with between-model semantic disagreement.[6] In the present study, vote entropy measures the distribution of ensemble votes over three explicit answer labels.
In medical question answering, Wu and colleagues evaluated uncertainty methods and proposed an explanation-verification approach.[7] Their preprint provides domain-specific context for evaluating uncertainty in biomedical tasks.
1.2. Objectives
We compared vote entropy and mean verbal uncertainty against a common ensemble-error outcome on the same questions. The primary estimand was the paired difference in error-detection AUROC between these scores.
Secondary analyses evaluated selective prediction, individual confidence calibration, class-specific errors, the addition of a seventh voting condition, and paired differences between Astra high and low reasoning effort. The two uncertainty scores were evaluated separately; no combined predictor was fitted.
2. Methods
We evaluated all 1,000 expert-labeled records in PubMedQA's original PQA-L file: 552 YES, 338 NO, and 110 MAYBE.[1] Requests contained the question and abstract context, excluding both the long answer and expert label. The first ten questions served as a technical pilot and were retained; a sensitivity analysis excludes them. This full-collection evaluation is not directly comparable with leaderboard scores on the official held-out test split.
Table 1. Recorded conditions and actual access routes
| Condition | Recorded model identifier | Route / effort |
|---|---|---|
| Astra high | gpt-6-astra | OpenAI Batch / high |
| Astra low | gpt-6-astra | OpenAI Batch / low |
| Claude Fable 5.1 | claude-fable-5-1 | Anthropic Batch / high |
| Gemini 3.8 Flash | gemini-3.8-flash | Google Batch / high |
| DeepSeek 4.1 Flash | accounts/fireworks/models/deepseek-v4p1-flash | Fireworks API / high |
| Kimi K3 | moonshotai/kimi-k3 | NVIDIA API / high |
| Qwen 3.8 27B | qwen/qwen3.8-27b (MLX 6-bit) | LM Studio / inherited xhigh |
Models were selected according to availability and cost and evaluated under the recorded configurations in Table 1. The seven conditions represent six model families: Astra high and Astra low share the same model identifier and together receive two sevenths of the vote and mean-confidence weight. The seven-condition panel was specified after examination of the original six-family results; analyses were therefore treated as exploratory.
Table 2. Denominators used throughout the analysis
| Question set | N | Purpose |
|---|---|---|
| All source questions | 1,000 | Operational coverage; paired Astra |
| Complete seven-condition cases | 993 | Matched individual comparisons |
| Unique ensemble pluralities | 989 | Main ensemble accuracy and error detection |
Each condition returned a YES/NO/MAYBE label and confidence from 0 to 100 that the selected label was correct. A unique plurality determined the ensemble answer. Refusals were treated as missing responses and tied pluralities as abstentions. Neither was converted to MAYBE or resolved using the reference label. Seven votes can tie at 3-3-1; a 3-2-2 split yields a unique plurality.
Appendices A and B describe statistical methods, prompts, model settings, and response processing. Version, prompt, and evaluation details are reported with reference to the transparency principles of TRIPOD-LLM.[8] Computational settings and context-capacity checks for the local model are reported in Appendix B.
3. Results
3.1. Error discrimination
Among 989 unique-plurality answers, 792 were correct and 197 disagreed with the expert reference, giving accuracy of 80.1% (95% CI, 77.7-82.6). Error was the positive outcome for discrimination analyses.
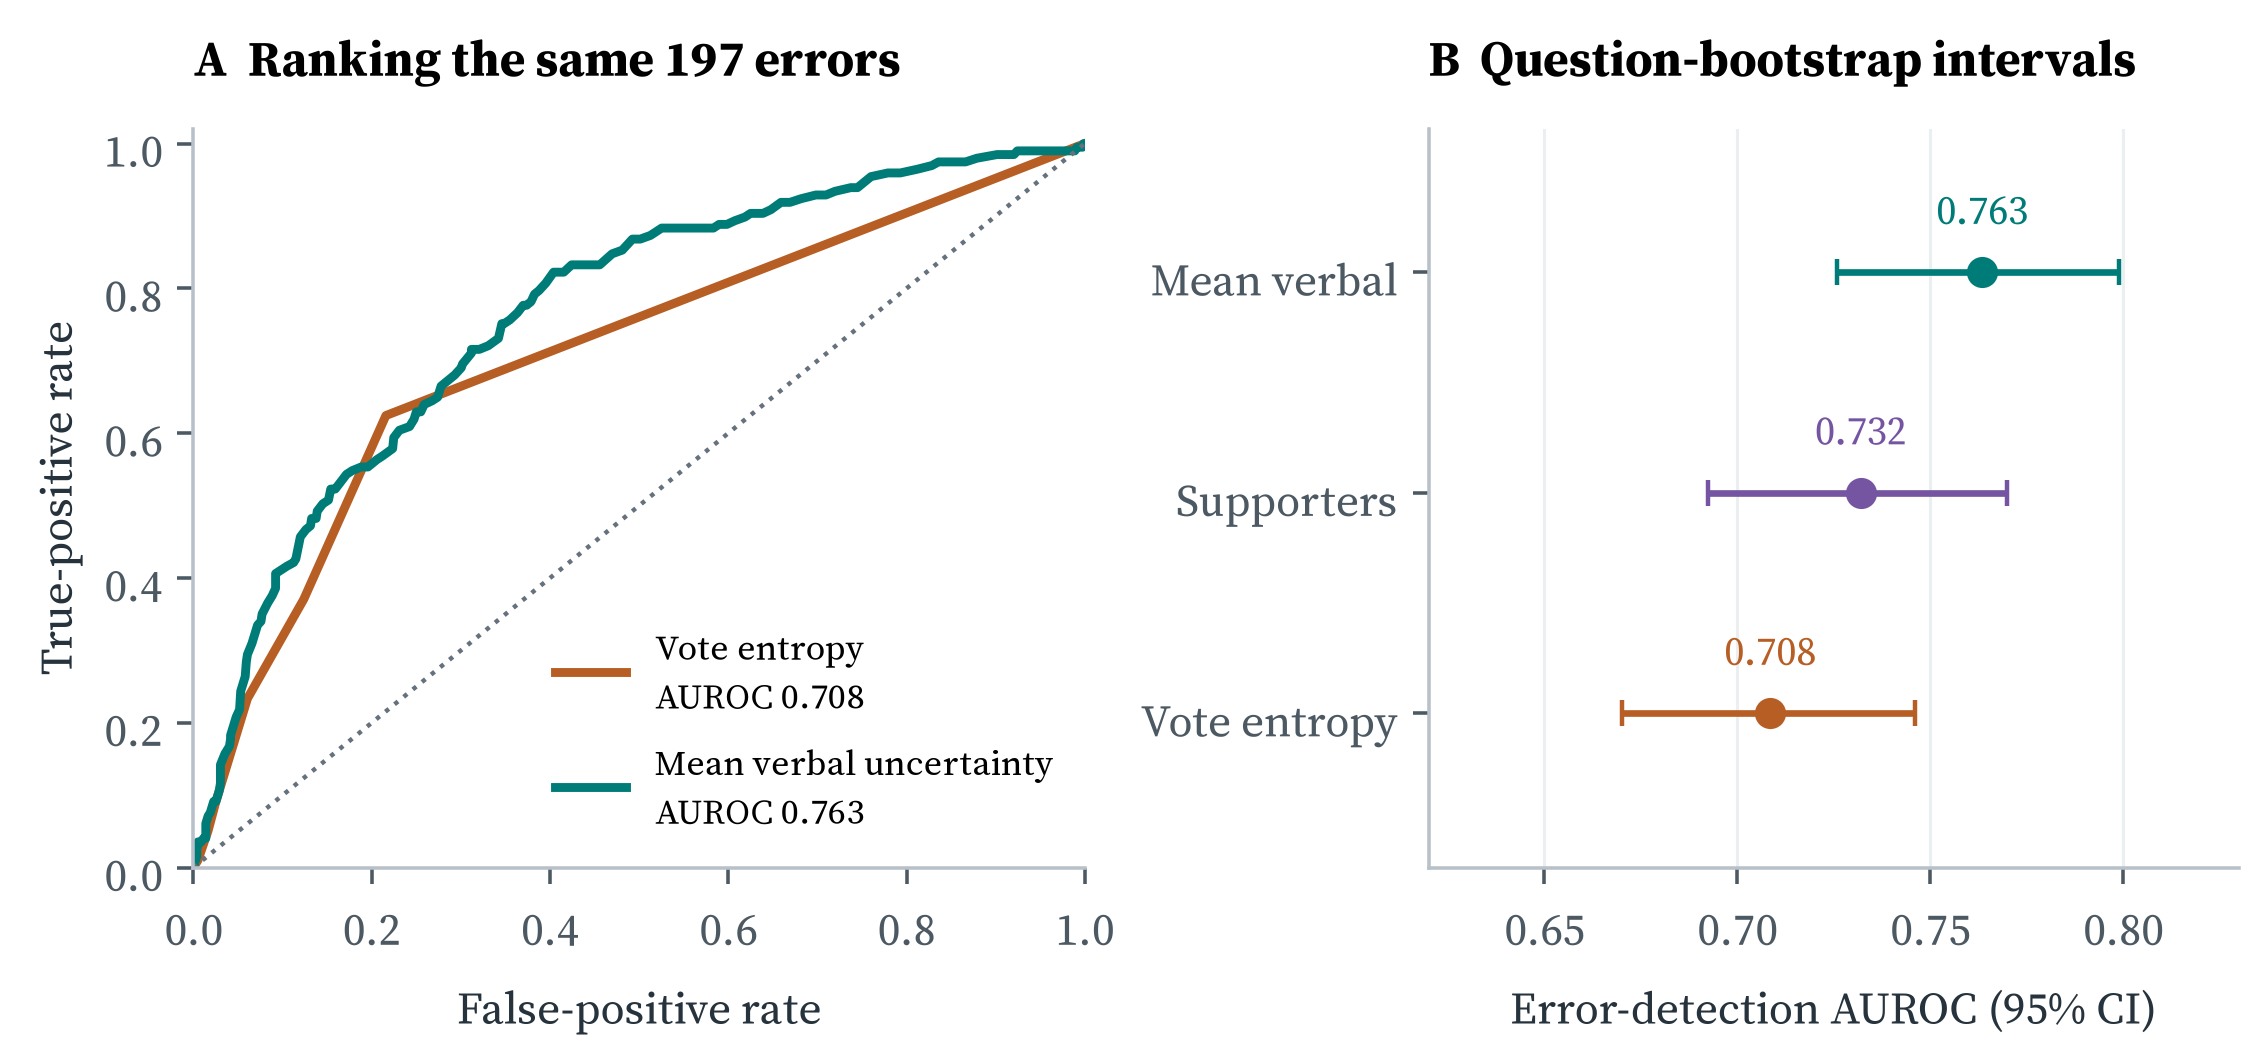
Mean verbal uncertainty had AUROC 0.763 (95% CI, 0.726-0.799), compared with 0.708 (0.670-0.746) for normalized vote entropy (Figure 1). The paired entropy-minus-verbal difference was -0.055 (-0.084 to -0.027). All 10,000 bootstrap resamples contributed to this comparison.
Average precision was 0.349 for entropy, 0.431 for verbal uncertainty, and 0.406 for supporter uncertainty, against an error prevalence of 19.9%. Supporter uncertainty, which uses confidence only from conditions selecting the plurality label, achieved AUROC 0.732 (95% CI, 0.692-0.770).
3.2. Unanimity and class-specific errors
The panel was unanimous on 695 questions. Of those answers, 621 were correct and 74 were incorrect, giving a unanimous error rate of 10.6% (Wilson 95% CI, 8.6-13.2). Those failures accounted for 37.6% of all 197 ensemble errors. The remaining 294 answered questions with disagreement contained 123 errors, or 41.8%.
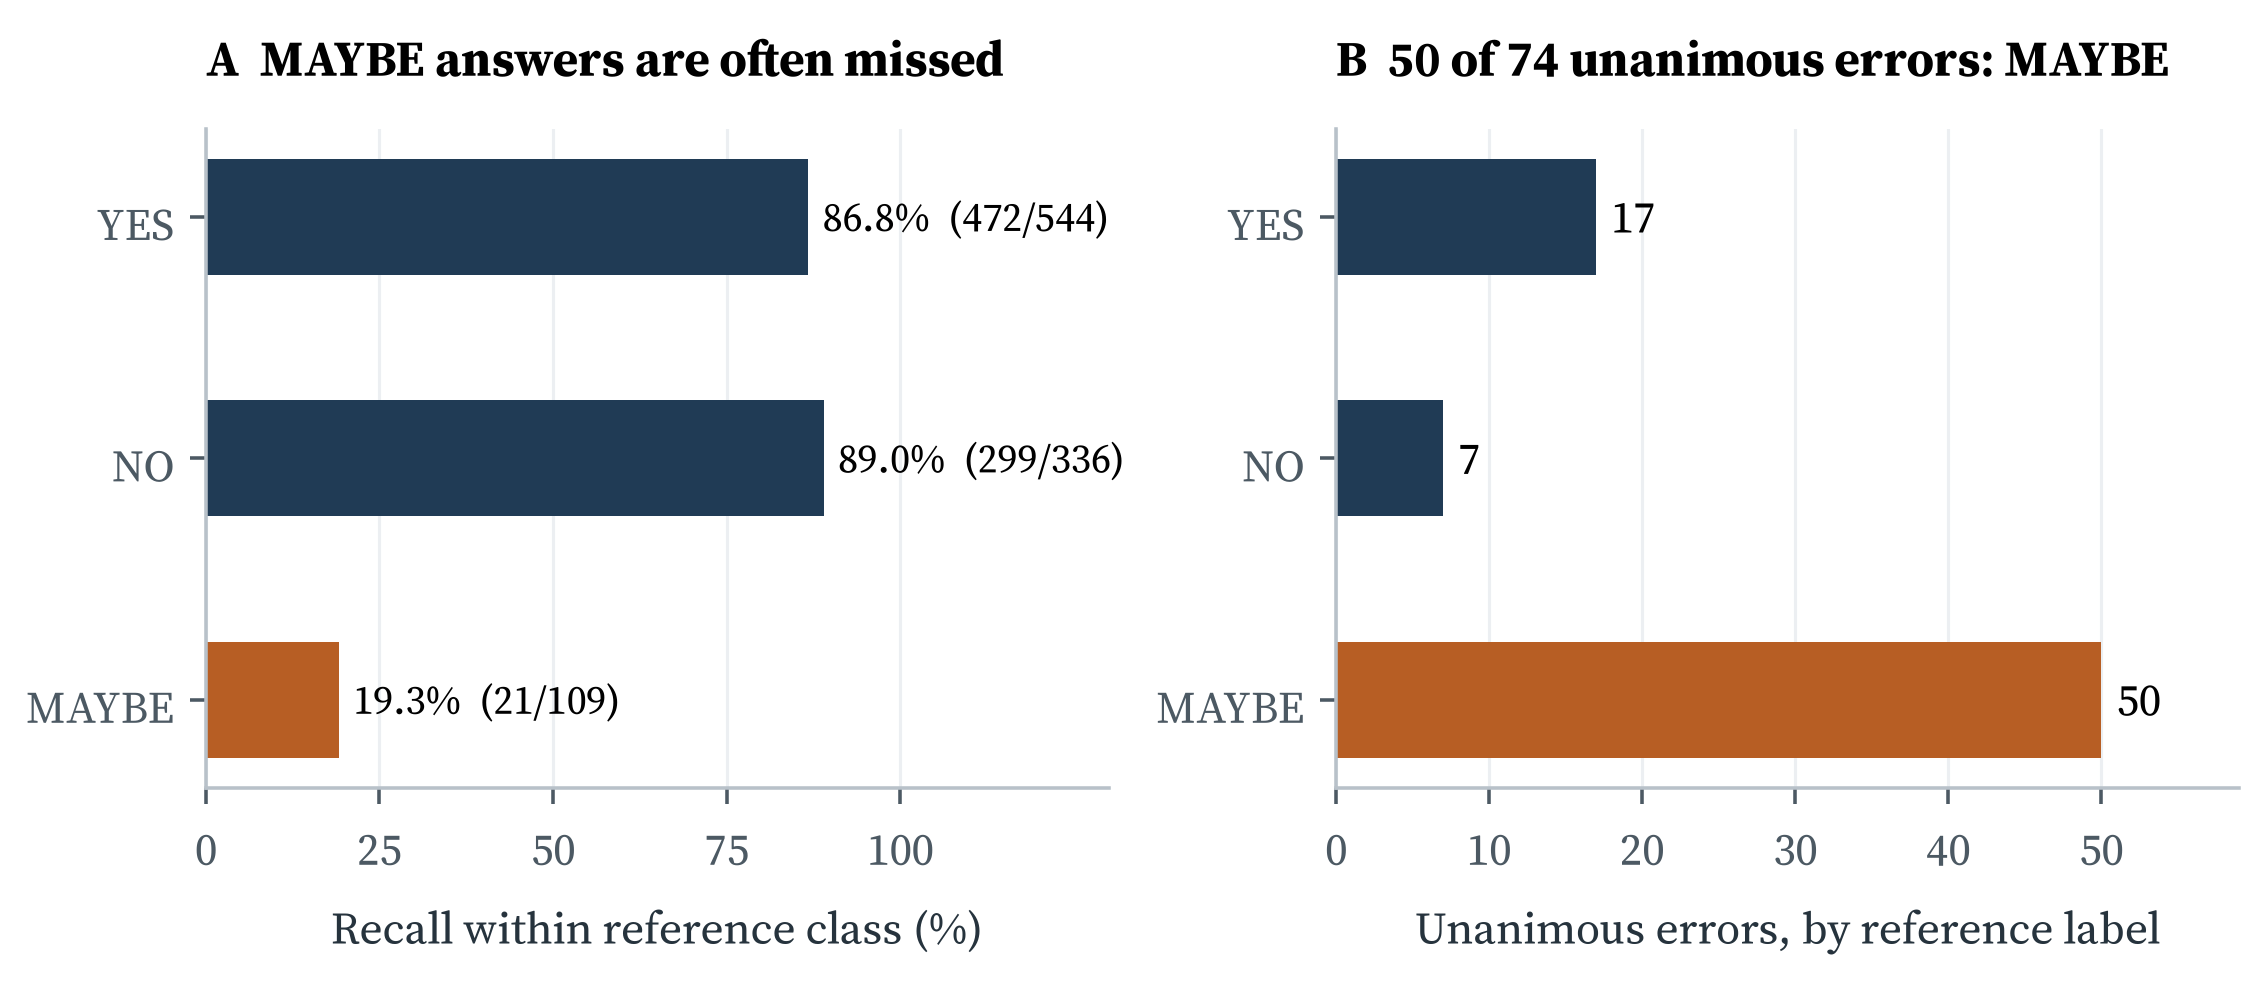
The ensemble correctly classified 472/544 YES questions, 299/336 NO questions, and 21/109 MAYBE questions (Figure 2). Balanced accuracy was 65.0%. Of the 74 unanimous errors, 50 had MAYBE reference labels, 17 had YES labels, and seven had NO labels.
MAYBE questions accounted for most unanimous errors despite comprising a minority of the dataset. Throughout the analysis, an error denotes disagreement with the expert benchmark label.
Error rates by vote pattern
Observed error rates were 40.7% for 6-1-0 votes and 35.1% for 5-2-0 votes. Several more fragmented vote patterns were uncommon and had wide proportion intervals. Error rates were therefore not monotonically ordered by entropy, although disagreement was associated with a higher error rate than unanimity.
3.3. Selective prediction
Selective prediction withholds answers above an uncertainty threshold, trading coverage for lower error.[9] An aggregate ranking metric and a specific operating point need not favor the same score.[10] Figure 3 shows attainable thresholds alongside their risk and coverage.
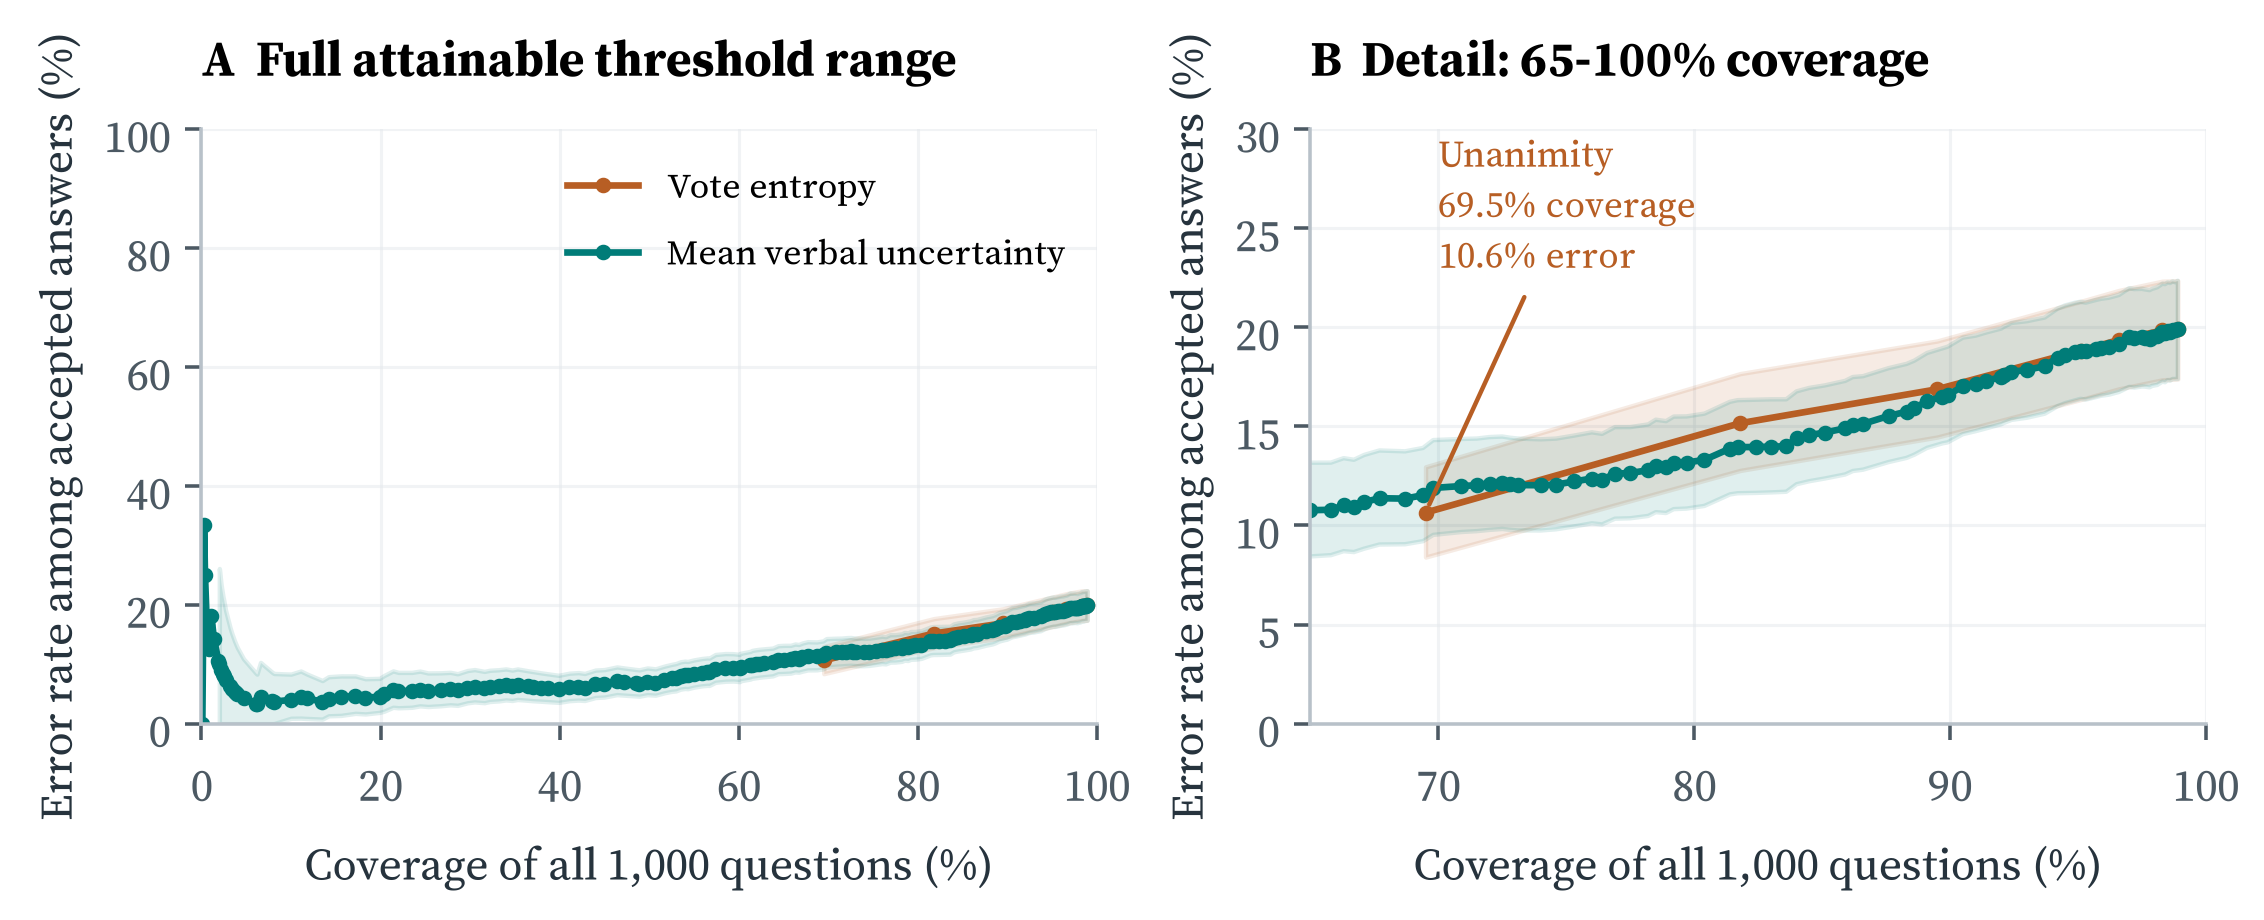
Table 3. Selected attainable entropy thresholds
| Acceptance rule | Accepted / all | Coverage | Accuracy |
|---|---|---|---|
| Unanimity (H = 0) | 695 / 1,000 | 69.5% | 89.4% |
| H <= 0.373303960386 | 818 / 1,000 | 81.8% | 84.8% |
| H <= 0.544568447628 | 895 / 1,000 | 89.5% | 83.1% |
| All unique pluralities | 989 / 1,000 | 98.9% | 80.1% |
Requiring unanimity retained 695/1,000 questions at 89.4% accuracy. Relaxing the entropy threshold to admit 6-1-0 splits raised coverage to 81.8% and lowered accuracy to 84.8%. The maximum coverage was 98.9%, because seven refusals and four ties remained withheld. Coverage always uses the full source dataset in this figure and table.
At requested 70% eligible coverage, expected accuracy was 89.4% for entropy and 88.5% for verbal uncertainty; at 80%, the corresponding values were 85.7% and 86.9%. These expectations use random selection within the boundary tied-score group (Appendix A). Thus, the relative performance of the scores varied with the operating point.
3.4. Seven-condition versus six-family panels
The original six-family panel included Astra high. The revised panel added Astra low after the original results had been examined. Both panels therefore draw on the same underlying question collection, while Astra's contribution increases from one sixth to two sevenths of the votes and mean-confidence weight.
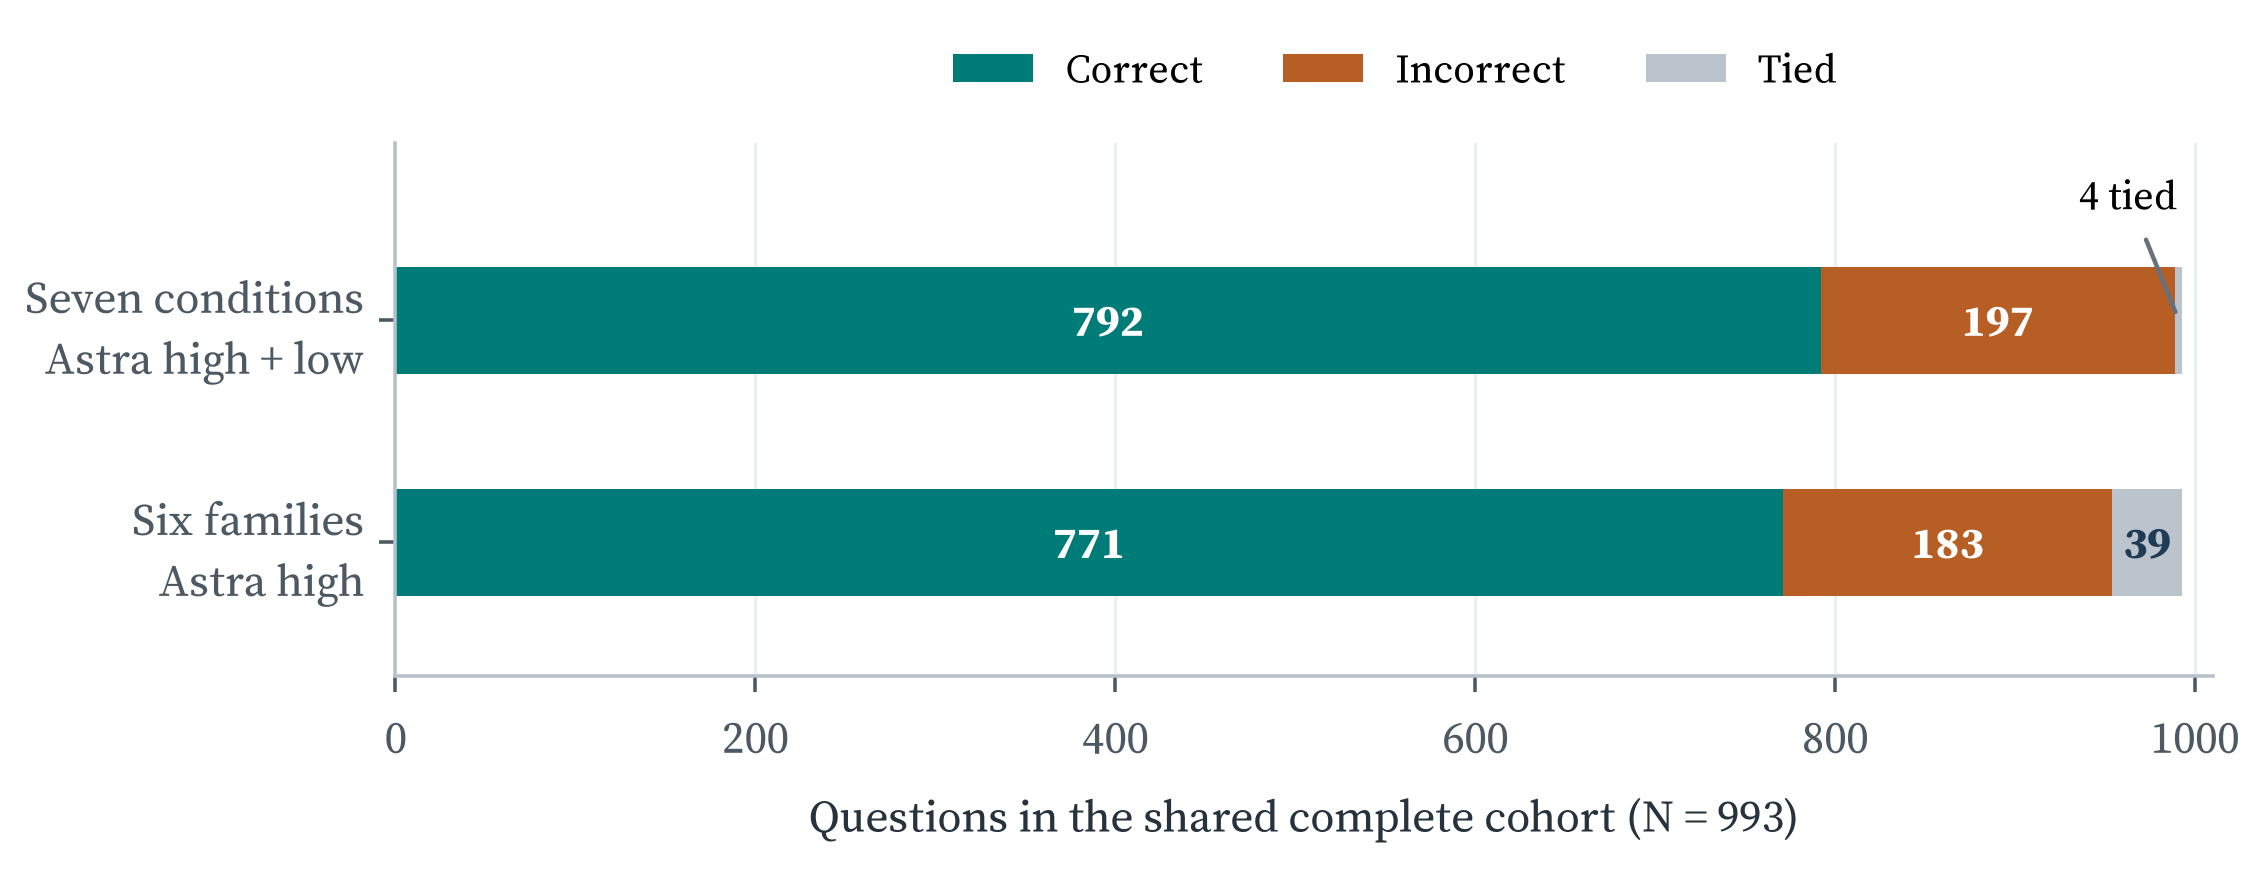
The original panel had 39 tied pluralities and 771 correct answers among 954 answers (80.8% accuracy). Adding Astra low resolved all 39 old ties, producing 24 correct and 15 incorrect answers. It also created four new ties, withholding three previously correct and one previously incorrect answer. The net change was 35 more answered questions: 21 additional correct answers and 14 additional errors. The paired tie-rate change was -3.5 percentage points (95% CI, -4.8 to -2.3), on the 993 complete questions.
Common-question comparison
On 950 questions with a unique plurality under both panels, predicted labels were identical and 768 were correct. This agreement follows from the voting rule: adding one vote can bring a competing label level with a unique leader but cannot move it ahead. The common-question comparison therefore isolates changes in uncertainty ranking.
On this shared subset, entropy AUROC increased by 0.004 (95% CI, 0.001-0.008), while verbal-uncertainty AUROC changed by -0.002 (-0.005 to 0.000, rounded). Full-panel comparisons additionally reflect changes in the set of answered questions.
The entropy-minus-verbal AUROC difference remained negative in every reported sensitivity analysis, including both six-family panels and analyses excluding contextualized prompts or response rescues (Appendix C).
3.5. Paired reasoning-effort comparison
The paired Astra comparison uses all 1,000 questions, including those excluded from the complete panel. High effort answered 806 correctly and low effort 802. Both were correct on 791 questions; only high was correct on 15, only low on 11, and both were wrong on 183. Answer agreement was 96.9%.
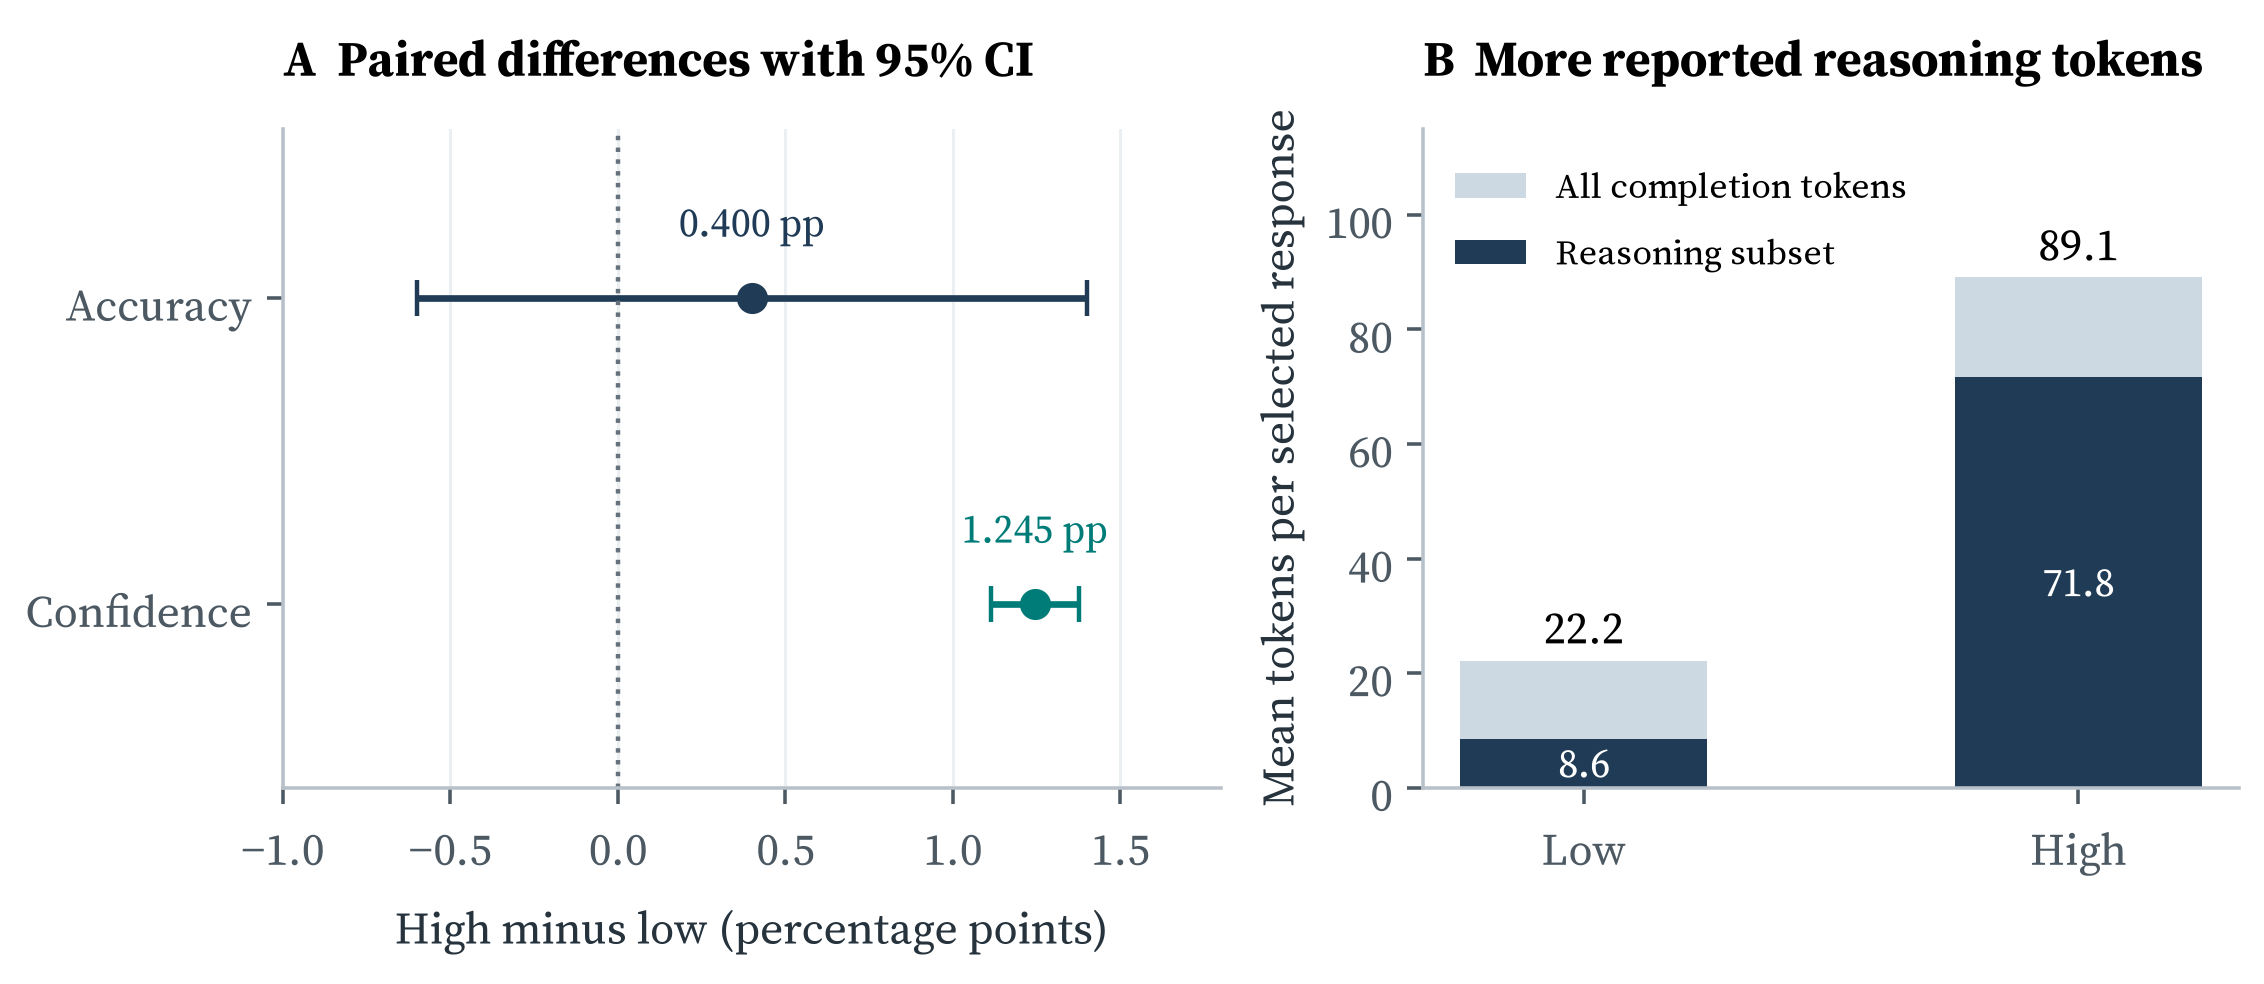
High-minus-low accuracy was +0.4 percentage points (95% CI, -0.6 to 1.4; exact two-sided McNemar P = .557). Mean reported confidence increased by 1.245 percentage points (1.114-1.377). The Brier-score difference was 0.00023 (-0.00728 to 0.00764); own-error AUROC differed by 0.010 (-0.016 to 0.035). The latter comparison uses each condition's own correctness outcome, unlike the shared ensemble-error target in the main analysis.
High effort used a mean of 71.8 reported reasoning tokens per selected response, compared with 8.6 for low effort. Mean completion-token counts were 89.1 and 22.2, respectively; mean total-token counts were 537.5 and 470.6. Reasoning tokens are included within completion-token totals. These summaries describe selected responses and exclude failed attempts.
Each condition contributed one selected response per question. High effort was associated with greater reported confidence and token use, while the accuracy difference was small and its confidence interval included zero.
3.6. Individual confidence and calibration
Calibration measures agreement between reported confidence and observed correctness, whereas discrimination measures separation of correct and incorrect answers.[11] We evaluated calibration using each condition's confidence in its own selected answer.
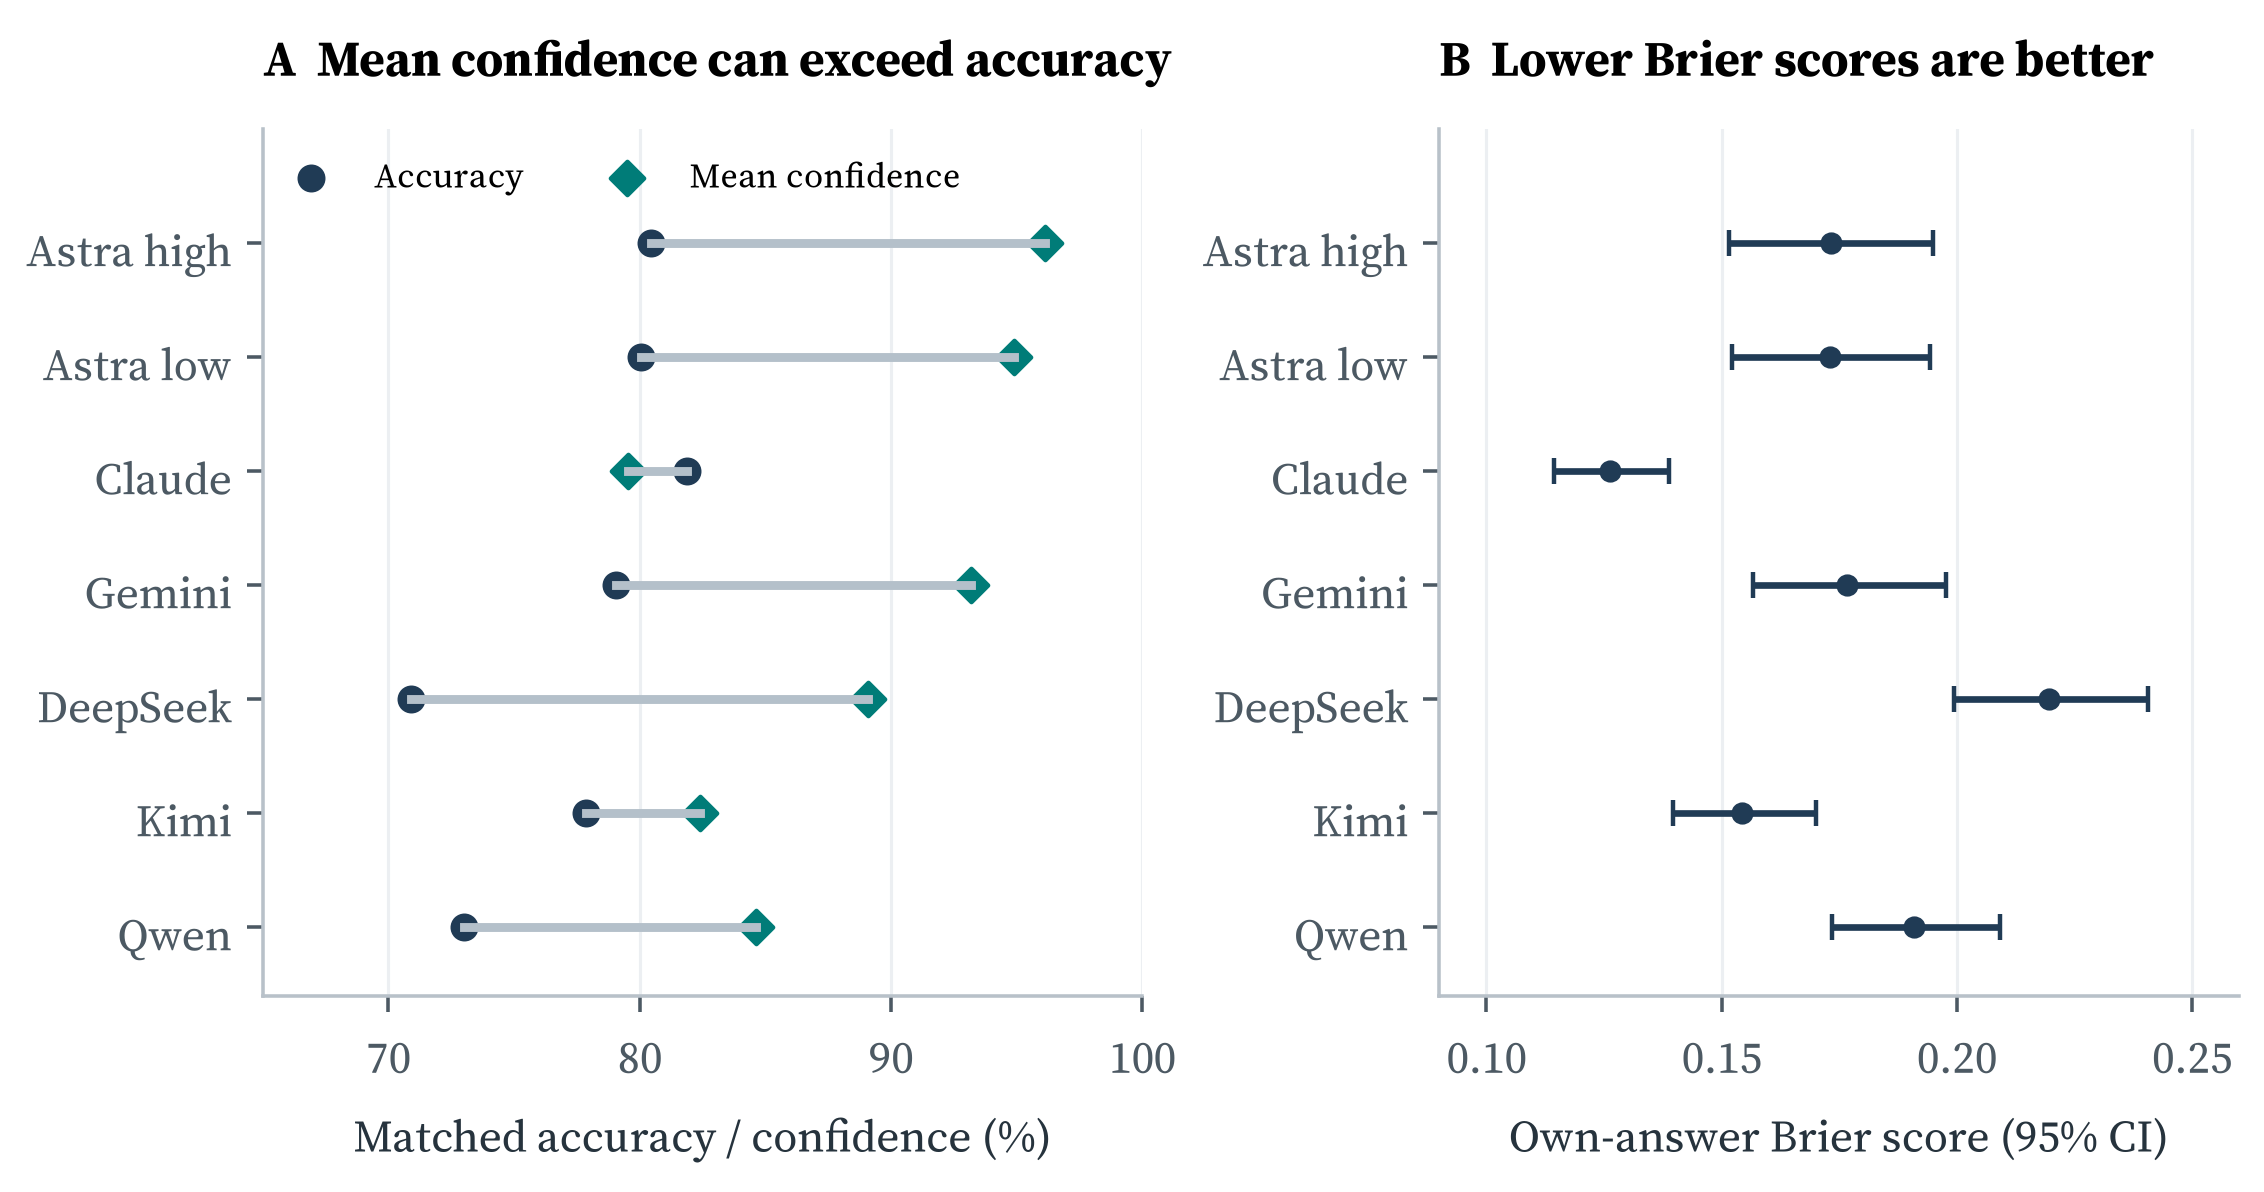
Across 993 complete questions, individual accuracy ranged from 70.9% for DeepSeek to 81.9% for Claude. Claude had the lowest observed binary Brier score, 0.126 (95% CI, 0.114-0.139), and expected calibration error (ECE), 0.048 (Figure 6). The matched individual results are reported in Appendix C.
The Brier score measures squared error between own-answer confidence and binary correctness.[12] ECE summarizes the confidence-accuracy gap across ten fixed bins. The mean-confidence versus accuracy differences in Figure 6 describe overall overconfidence or underconfidence; ECE additionally captures variation across bins.
Ensemble uncertainty score
The ensemble score averages confidence in each condition's selected label. Because these labels may differ, the average is an uncertainty-ranking statistic rather than a probability assigned to a single ensemble answer. Brier score and ECE were consequently evaluated at the individual-condition level.
4. Discussion
Prior work has evaluated verbal confidence and semantic uncertainty across different sampling strategies and tasks.[3, 4, 5, 6] In this biomedical classification task, mean verbal uncertainty outperformed vote entropy for identifying ensemble errors. Both scores contained information about correctness, but their relative performance depended on whether evaluation emphasized overall ranking or a particular coverage level.
4.1. Principal findings
Unanimity increased accuracy from 80.1% to 89.4% while retaining 69.5% of the original questions. The 74 errors among unanimous answers show that agreement can coexist with shared mistakes. Their concentration in MAYBE questions, together with MAYBE recall of 19.3%, suggests that interpretation of inconclusive evidence was a principal source of difficulty in this dataset.
Adding Astra low increased answer coverage by resolving most ties, with a net gain of 21 correct and 14 incorrect answers. On questions answered by both panels, the predicted labels were unchanged as a consequence of the voting rule. Panel expansion therefore affected coverage and uncertainty ranking through distinct mechanisms. It also increased the voting weight of the Astra family.
In the paired Astra analysis, high effort increased reported confidence and reasoning-token use without a clearly resolved accuracy benefit. The accuracy interval was compatible with effects ranging from a small disadvantage to a modest benefit. This divergence between confidence and accuracy complements the individual calibration results, in which several conditions reported mean confidence above their observed accuracy.
4.2. Study limitations
This study evaluated a single public benchmark using one selected response per question and condition. Generalization to other biomedical tasks and variability across repeated generations remain to be assessed; prior training exposure to the benchmark is unknown. The seven-condition panel and some analytic choices followed inspection of earlier results, so inference is exploratory. Confidence intervals reflect question sampling conditional on the evaluated panel, and no multiplicity adjustment was applied.
The paired uncertainty comparison holds the ensemble answers and questions fixed, but individual-model comparisons describe the configurations tested rather than isolating model architecture, quantization, sampling, or reasoning effort. Response processing included contextualized Claude retries and repeat generation after incomplete outputs. Sensitivity analyses excluding these observations retained the direction of the primary result.
4.3. Conclusions
Mean verbal uncertainty provided stronger error discrimination than vote entropy in this PubMedQA ensemble. Unanimity improved retained-answer accuracy, while persistent MAYBE errors highlighted shared difficulty with inconclusive evidence. A seventh voting condition increased coverage but did not change answers on the common unique-plurality subset. Evaluation on additional biomedical datasets, repeated generations, and a combined confidence-and-disagreement predictor would clarify the reproducibility and complementary value of these signals.
Appendix A. Definitions and statistical methods
Outcome and uncertainty scores
The unique plurality is the single label with the largest vote count. Error is disagreement with the expert label. Each condition has one vote, and the main panel requires all seven answers. There were 983 strict majorities and six 3-2-2 unique pluralities among the 989 answers.
Let p(l) be a label's fraction of seven votes and c(m) a condition's confidence divided by 100. Entropy is the negative sum of p(l) times ln[p(l)], divided by ln(3); zero-probability terms are zero. Mean verbal uncertainty is one minus mean c(m). Supporter uncertainty subtracts from one the mean confidence of plurality supporters. Higher scores mean greater uncertainty. Scores are rounded to 12 decimals for grouping.
Discrimination and paired inference
Error was the positive outcome for AUROC, with tied rankings receiving half credit. Average precision was calculated as the noninterpolated precision-recall summary. The principal contrast was entropy-minus-verbal AUROC on the same 989 answers. Scores were evaluated without fitting a prediction model or calibrator.
Percentile 95% intervals used 10,000 nonparametric question-bootstrap resamples with seed 20260912, following Efron's resampling framework.[13] Paired estimates used identical question draws and retained all condition responses for each sampled question. Eligibility was fixed before resampling. Intervals are conditional on the evaluated panel and are unadjusted for multiplicity.
Selective prediction and proportions
Risk is errors divided by accepted answers; operational coverage is accepted answers divided by 1,000. Deterministic curves accept whole tied-score groups. Bootstrap risk intervals hold the threshold fixed and are pointwise, not coverage intervals or simultaneous bands. Shading is omitted for fewer than 20 accepted answers or identical outcomes, where empirical bootstrap intervals can mislead. Wilson intervals describe vote-pattern and calibration-bin proportions.[14]
Fixed-budget expectations accepted floor(q times 989) questions, selecting uniformly at random within the boundary tied-score group. At q = 0.70, 692 answers gave actual eligible coverage of 69.97%; expected accuracy was 89.4% for entropy and 88.5% for verbal uncertainty. At q = 0.80, the corresponding values were 85.7% and 86.9%. These expectations were reported descriptively without confidence intervals.
Individual and within-family comparisons
Individual metrics use 993 matched questions; available-case metrics retain 1,000 except Claude's 993. Balanced accuracy averages class recall; macro F1 weights classes equally. Binary Brier is mean squared error between own-answer confidence and correctness. ECE uses ten fixed left-closed bins, including 1.0 in the last. Accuracy, Brier, and mean confidence have bootstrap intervals; other individual metrics are descriptive. Astra pairs all 1,000 questions, with an exact two-sided McNemar test for discordant correctness.
Appendix B. Collection and reproducibility
Prompt and response selection
All requests used one user message with streaming disabled. The common prompt requested a context-grounded YES/NO/MAYBE answer and confidence in that label as two JSON fields. Expert labels and long answers were excluded from requests. Original valid responses were retained; failed requests were supplemented by documented retries or extraction of an unambiguous final JSON object. Selection did not depend on correctness. Reference labels were joined after response validation.
Claude's primary prompt appended "Please think before responding." Requests specified high output effort without a separate thinking parameter or thinking-token budget. Of 993 selected answers, 981 used the primary prompt and 12 used a contextualized benchmark retry. Forty-two required final-JSON extraction, including one contextualized retry. Extraction retained a completed response containing exactly one valid final answer object. Seven questions remained refused; all had YES reference labels.
Table B1. Output ceilings among selected responses
| Condition | Selected output ceilings (tokens) |
|---|---|
| Astra high / low | 4,096 each, on all 1,000 questions |
| Claude; Kimi | 4,096 throughout |
| Gemini | 4,096 x 968; 12,288 x 32 truncation rescues |
| DeepSeek | 4,096 x 10 pilot; 12,288 x 990 main-run extension |
| Qwen | 4,096 x 968; 12,288 x 30; no explicit client cap x 2 |
Temperature was set to 1 for Kimi and 0 for Qwen and omitted for other conditions. No seed or top-p value was supplied. Qwen inherited xhigh reasoning effort from the loaded template. The local MLX 6-bit model occupied 22,805,016,658 bytes and ran in LM Studio on an Apple M4 Max with 36 GB unified memory, a configured context of 16,384 tokens, and parallel capacity four. Provider defaults, the local weight checksum, and runtime versions were not recorded.
Context capacity and output completion
All 1,000 selected Qwen requests contained the complete question and abstract specified by the common template. Reported input length was at most 1,017 tokens; the maximum selected input-plus-output total was 14,969 tokens, below the configured 16,384-token context. All selected Qwen responses ended with a stop finish reason. These checks provided no evidence that context capacity constrained the evaluated Qwen responses.
Output-token ceilings were handled separately from input context capacity. Gemini and Qwen each required 32 retries after incomplete outputs at the initial ceiling. Gemini's retries completed at 12,288 tokens; Qwen completed 30 at that ceiling and two with no explicit client output cap. Final analyses used completed answers. Claude JSON extraction reformatted an existing answer without generating a replacement. The primary AUROC contrast remained negative after excluding response rescues and extraction recoveries (Appendix C).
Provenance and computational checks
Responses were collected on September 12-13, 2026 (UTC). The source dataset SHA-256 was 8b3276be8942ebbd77f3ddcda12c1749bf0e490045a736fd8438ee40cf37a41d. The archived analysis package contains 7,000 selected response slots, 6,993 valid answers, seven refusals, request settings, exact prompts, and the historical attempt ledger.
A separate computational implementation reproduced the analysis with 145,004 assertions. Figures and tables were generated from the verified results; ROC areas were also recomputed from question-level scores during figure generation. Reproduction commands and input hashes are retained in the analysis package.
Appendix C. Sensitivity and calibration results
Panel and collection sensitivities
Table C1. Within-panel entropy-minus-verbal comparisons
| Analysis | Cohort / answers | Entropy / verbal AUROC | Difference (95% CI) |
|---|---|---|---|
| Six: Astra high | 993 / 954 | 0.700 / 0.768 | -0.068 (-0.099 to -0.037) |
| Six: Astra low | 993 / 950 | 0.701 / 0.765 | -0.064 (-0.095 to -0.033) |
| Claude primary only | 981 / 977 | 0.707 / 0.763 | -0.056 (-0.085 to -0.027) |
| No rescue / extraction | 879 / 879 | 0.705 / 0.759 | -0.054 (-0.086 to -0.023) |
| Exclude first ten | 983 / 979 | 0.709 / 0.765 | -0.056 (-0.085 to -0.027) |
| Seven: common unique | 950 / 950 | 0.705 / 0.767 | -0.062 (-0.093 to -0.032) |
| Six high: common unique | 950 / 950 | 0.701 / 0.770 | -0.068 (-0.099 to -0.037) |
Differences in Table C1 are entropy-minus-verbal AUROC within each cohort, with paired question-bootstrap intervals. Common-unique analyses include the 950 questions with a unique plurality under both panels. The analysis excluding response rescues and extraction recoveries is restricted by observed response processing; the six-family analyses use their respective unique-plurality cohorts.
Individual conditions on 993 matched questions
Table C2. Matched accuracy and own-answer calibration
| Condition | Accuracy %, 95% CI | Brier, 95% CI | ECE |
|---|---|---|---|
| Astra high | 80.5 (77.9 to 82.9) | 0.173 (0.152 to 0.195) | 0.157 |
| Astra low | 80.1 (77.5 to 82.5) | 0.173 (0.152 to 0.194) | 0.148 |
| Claude high | 81.9 (79.4 to 84.2) | 0.126 (0.114 to 0.139) | 0.048 |
| Gemini high | 79.1 (76.5 to 81.5) | 0.177 (0.157 to 0.198) | 0.141 |
| DeepSeek high | 70.9 (68.0 to 73.7) | 0.220 (0.199 to 0.241) | 0.182 |
| Kimi high | 77.8 (75.2 to 80.4) | 0.154 (0.140 to 0.170) | 0.060 |
| Qwen xhigh | 73.0 (70.2 to 75.8) | 0.191 (0.174 to 0.209) | 0.116 |
Accuracy and Brier intervals in Table C2 are question-bootstrap intervals. Brier scores describe confidence in binary own-answer correctness; ECE uses ten fixed bins. Individual MAYBE recall ranged from 15.5% to 33.6%. Full confusion matrices, calibration bins, macro F1, own-error AUROCs, and available-case estimates are retained in the analysis package.
Appendix D. Prompts and declarations
Common prompt
Based only on the provided abstract context, answer the research question.
Choose YES if the context supports an affirmative answer, NO if it supports a negative answer, or MAYBE if the evidence is inconclusive or insufficient to choose YES or NO.
Report your confidence from 0 to 100 that your chosen answer is correct. This is confidence in your selected label, not the probability of YES.
Return a JSON object with exactly two fields: "answer" (YES, NO, or MAYBE) and "confidence" (a number from 0 to 100). Do not include an explanation in the final answer.

Research question:
{question}

Abstract context:
{context}
The research-question placeholder is replaced with the dataset question; the context placeholder contains abstract paragraphs joined by blank lines. The common template SHA-256 is 625dd2d67e7a194d27a8a9421067f759348913f732331d4838c35733aa22eb99. Claude's primary template appends its thinking instruction. Its contextualized retry prepends the following statement:
This is a PubMedQA research benchmark evaluating classification of published abstracts. The requested output is only a YES, NO, or MAYBE label and confidence based on the supplied text. This is not a request for patient-specific medical advice, treatment recommendations, experimental procedures, or instructions to perform biological work.Data and code availability
The original PubMedQA data and evaluation utilities are publicly available at https://github.com/pubmedqa/pubmedqa.[1] Study-specific responses, request settings, prepared data, and analysis code are retained locally and have not been deposited in a public repository.
Study materials
The study used published benchmark questions and abstracts. No participants were recruited and no new patient data were collected.
Use of AI tools
AI tools assisted with manuscript drafting and editing, analysis code, figure preparation, and computational and reference checks.
References
1. Jin Q, Dhingra B, Liu Z, Cohen W, Lu X. PubMedQA: A Dataset for Biomedical Research Question Answering. Proceedings of EMNLP-IJCNLP. 2019:2567-2577. Source.
2. Subramanian A, Schlegel V, Ramesh Kashyap A, Nguyen TT, Dwivedi VP, Winkler S. M-QALM: A Benchmark to Assess Clinical Reading Comprehension and Knowledge Recall in Large Language Models via Question Answering. Findings of the Association for Computational Linguistics: ACL 2024. 2024:4002-4042. Source.
3. Tian K, Mitchell E, Zhou A, Sharma A, Rafailov R, Yao H, Finn C, Manning C. Just Ask for Calibration: Strategies for Eliciting Calibrated Confidence Scores from Language Models Fine-Tuned with Human Feedback. Proceedings of EMNLP. 2023:5433-5442. Source.
4. Xiong M, Hu Z, Lu X, Li Y, Fu J, He J, Hooi B. Can LLMs Express Their Uncertainty? An Empirical Evaluation of Confidence Elicitation in LLMs. International Conference on Learning Representations. 2024. Source.
5. Farquhar S, Kossen J, Kuhn L, Gal Y. Detecting hallucinations in large language models using semantic entropy. Nature. 2024;630:625-630. Source.
6. Hamidieh K, Thost V, Gerych W, Yurochkin M, Ghassemi M. Complementing Self-Consistency with Cross-Model Disagreement for Uncertainty Quantification. International Conference on Learning Representations. 2026. Source.
7. Wu J, Yu Y, Zhou HY. Uncertainty Estimation of Large Language Models in Medical Question Answering. arXiv:2407.08662. 2024. Preprint. Source.
8. Gallifant J, Afshar M, Ameen S, et al. The TRIPOD-LLM reporting guideline for studies using large language models. Nature Medicine. 2025;31:60-69. Source.
9. El-Yaniv R, Wiener Y. On the Foundations of Noise-free Selective Classification. Journal of Machine Learning Research. 2010;11:1605-1641. Source.
10. Traub J, Bungert TJ, Lüth CT, Baumgartner M, Maier-Hein KH, Maier-Hein L, Jäger PF. Overcoming Common Flaws in the Evaluation of Selective Classification Systems. Advances in Neural Information Processing Systems 37. 2024. Source.
11. Guo C, Pleiss G, Sun Y, Weinberger KQ. On Calibration of Modern Neural Networks. Proceedings of Machine Learning Research. 2017;70:1321-1330. Source.
12. Brier GW. Verification of forecasts expressed in terms of probability. Monthly Weather Review. 1950;78:1-3. Source.
13. Efron B. The Jackknife, the Bootstrap and Other Resampling Plans. CBMS-NSF Regional Conference Series in Applied Mathematics, vol. 38. Philadelphia: SIAM; 1982. Source.
14. Wilson EB. Probable Inference, the Law of Succession, and Statistical Inference. Journal of the American Statistical Association. 1927;22(158):209-212. Source.